Dashboard
The dashboard for presenting the results of this project was made programmatically using the Tremor framework of React Javascript. The web app was made using the NextJS framework and TypeScript.
Tech Stack
The dashboard is built using the following technologies:
-
Frontend Framework: React Tremor, Leaflet
-
Backend Framework: FastAPI (development), Flask/Quart (production)
-
Deployment: AWS Lambda
Example usage
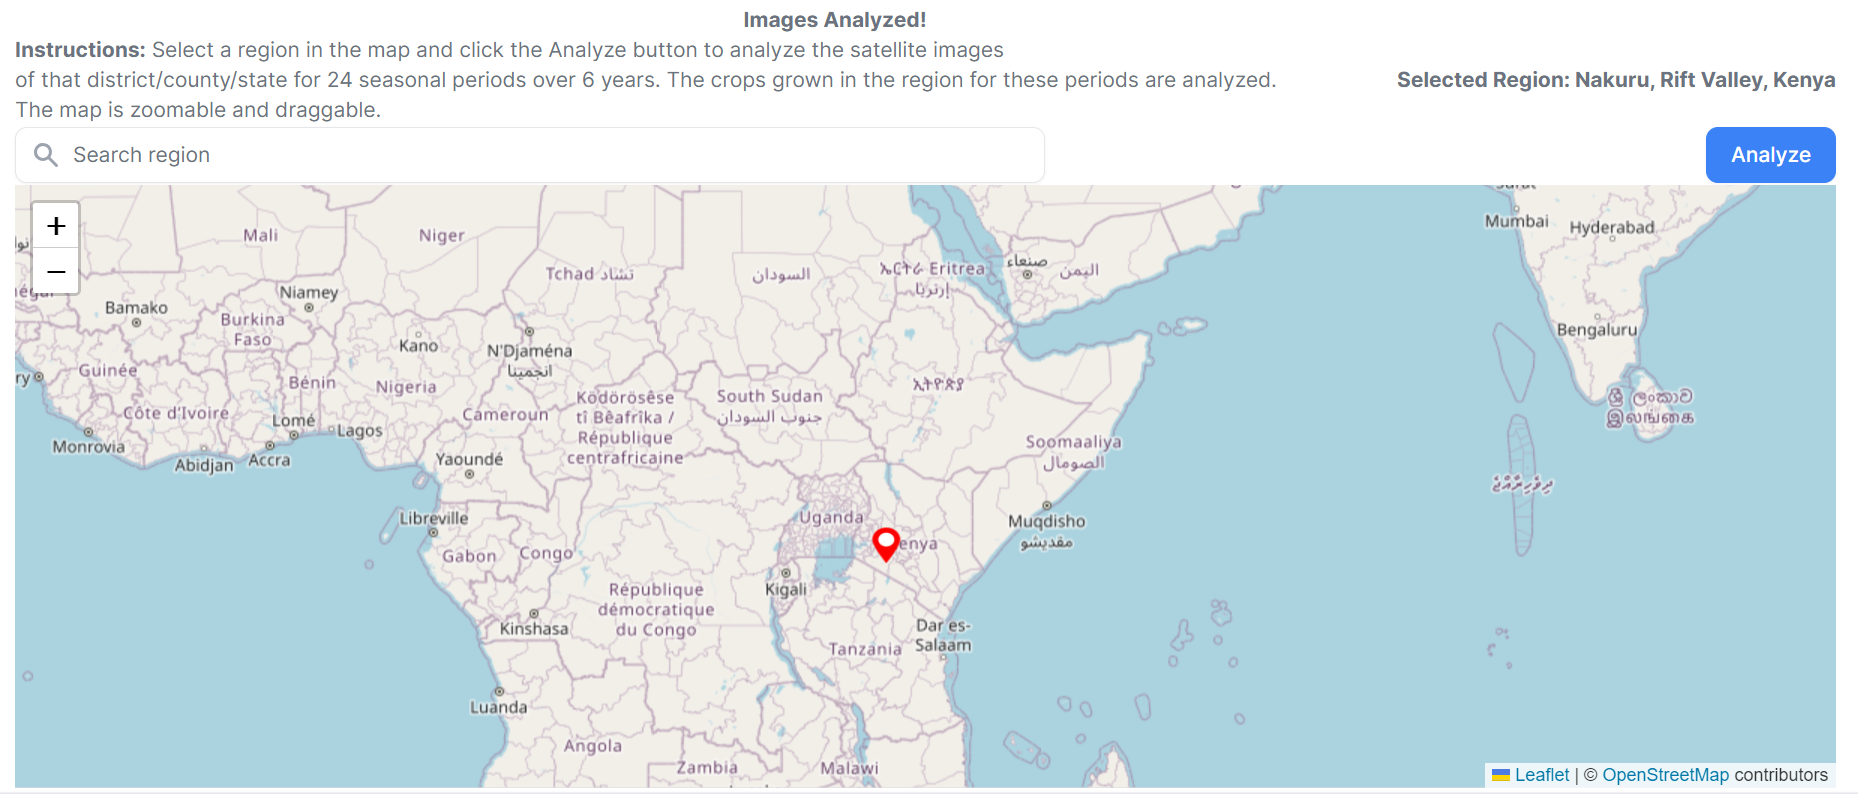
The dashboard contains an interactive world map on which any region can be selected.
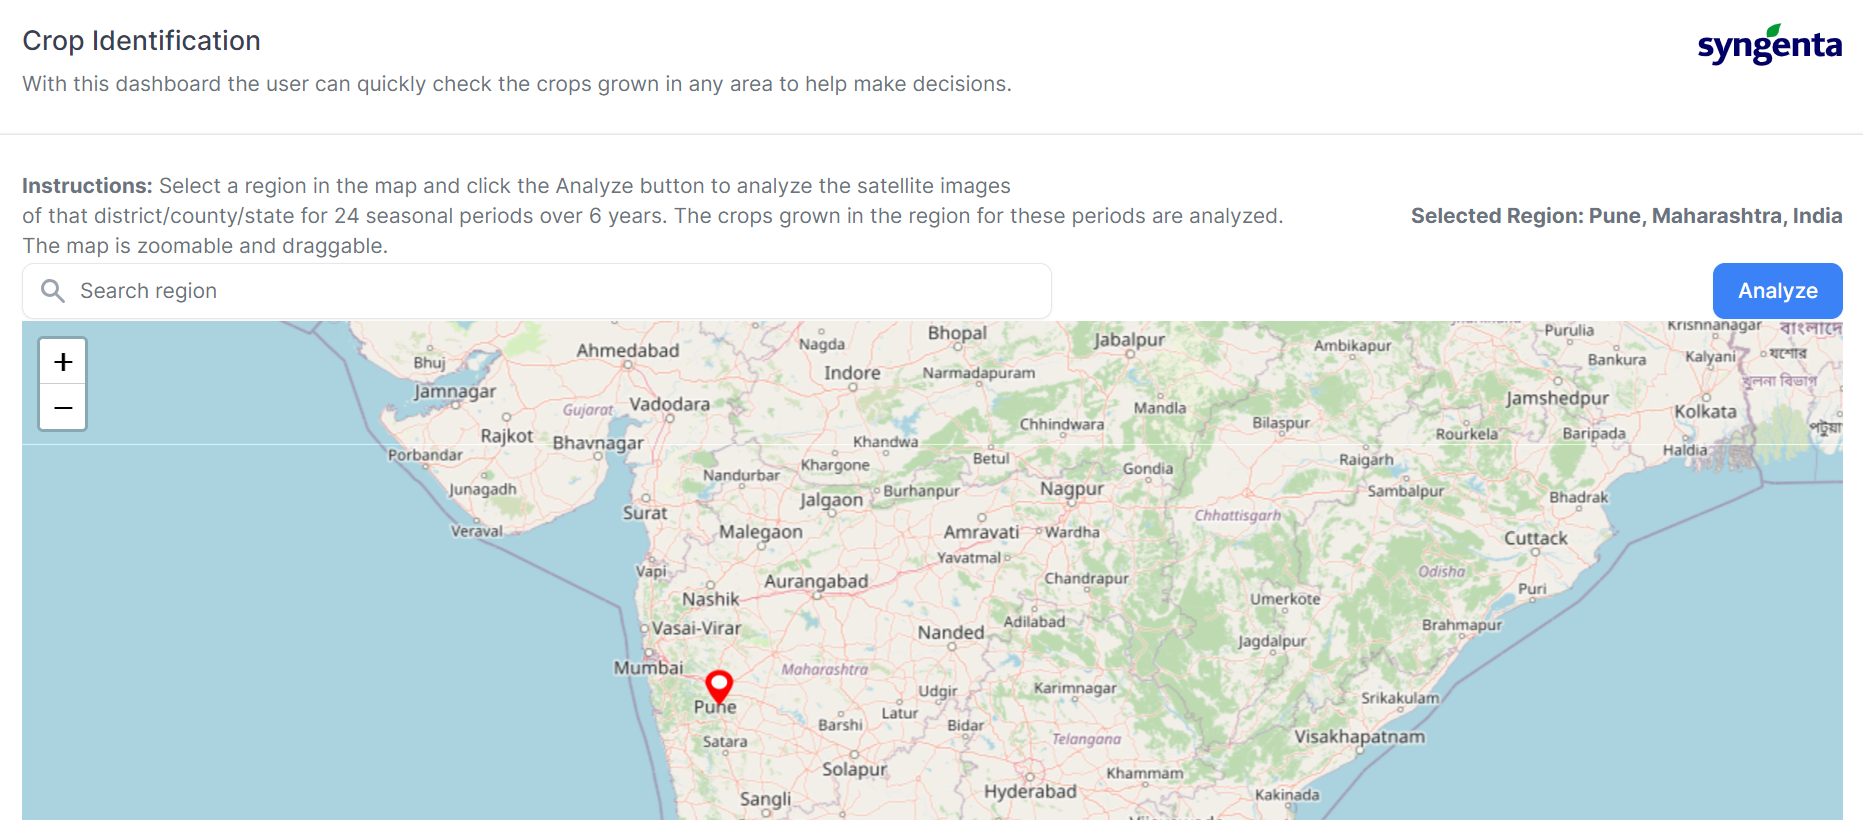
Upon clicking the Analyze button, the satellite images are downloaded and analyzed.
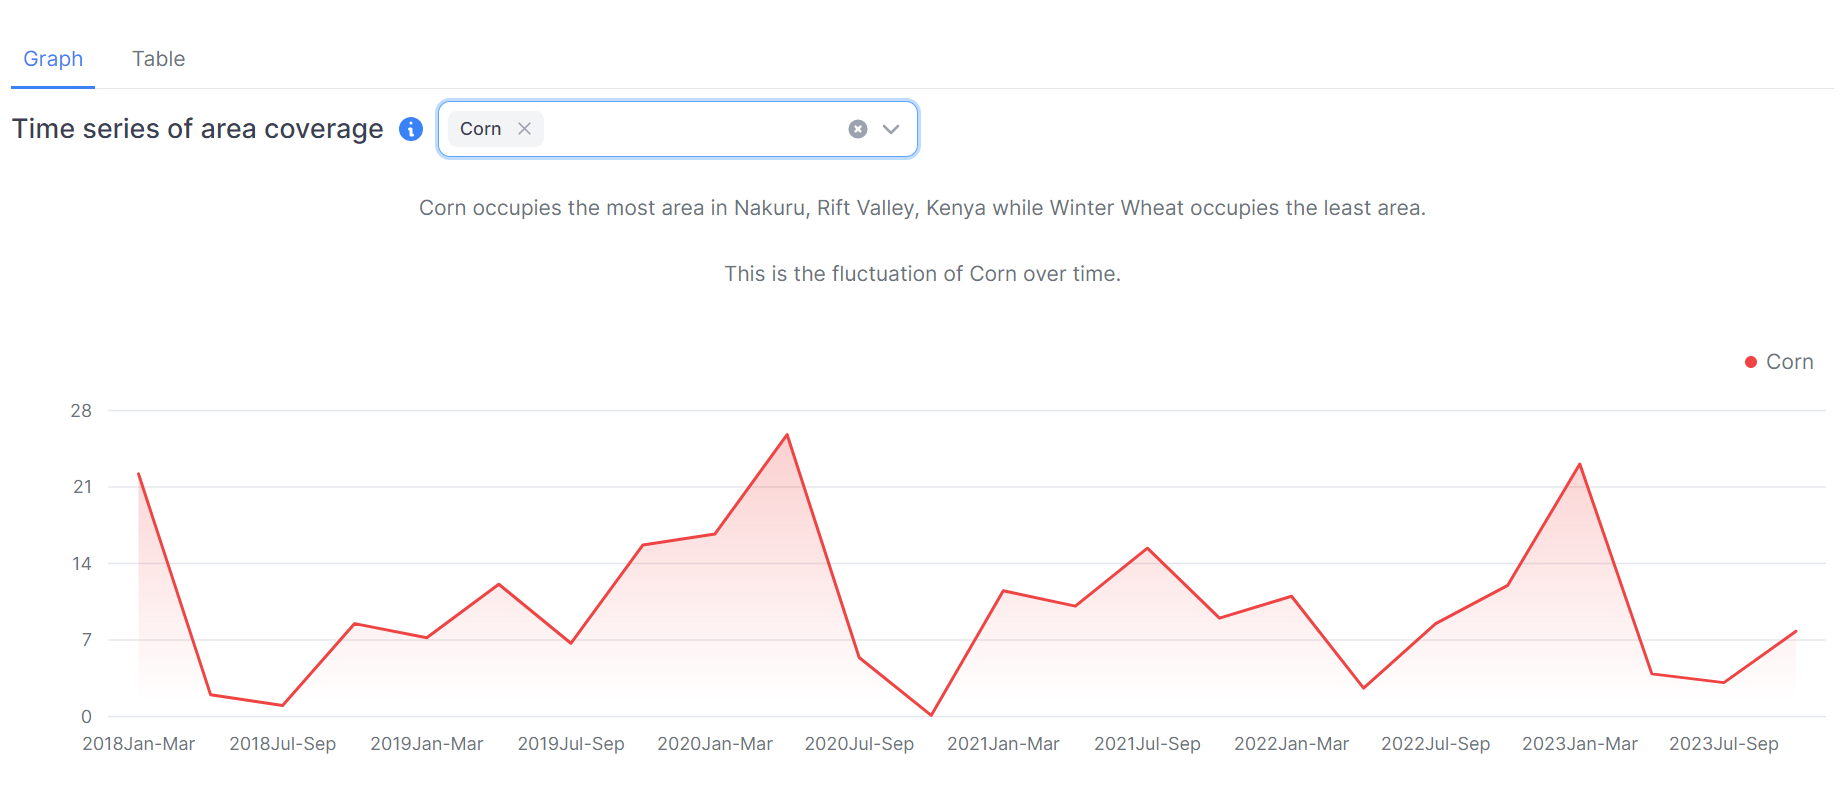
Time series fluctuation of crops area coverage is displayed.
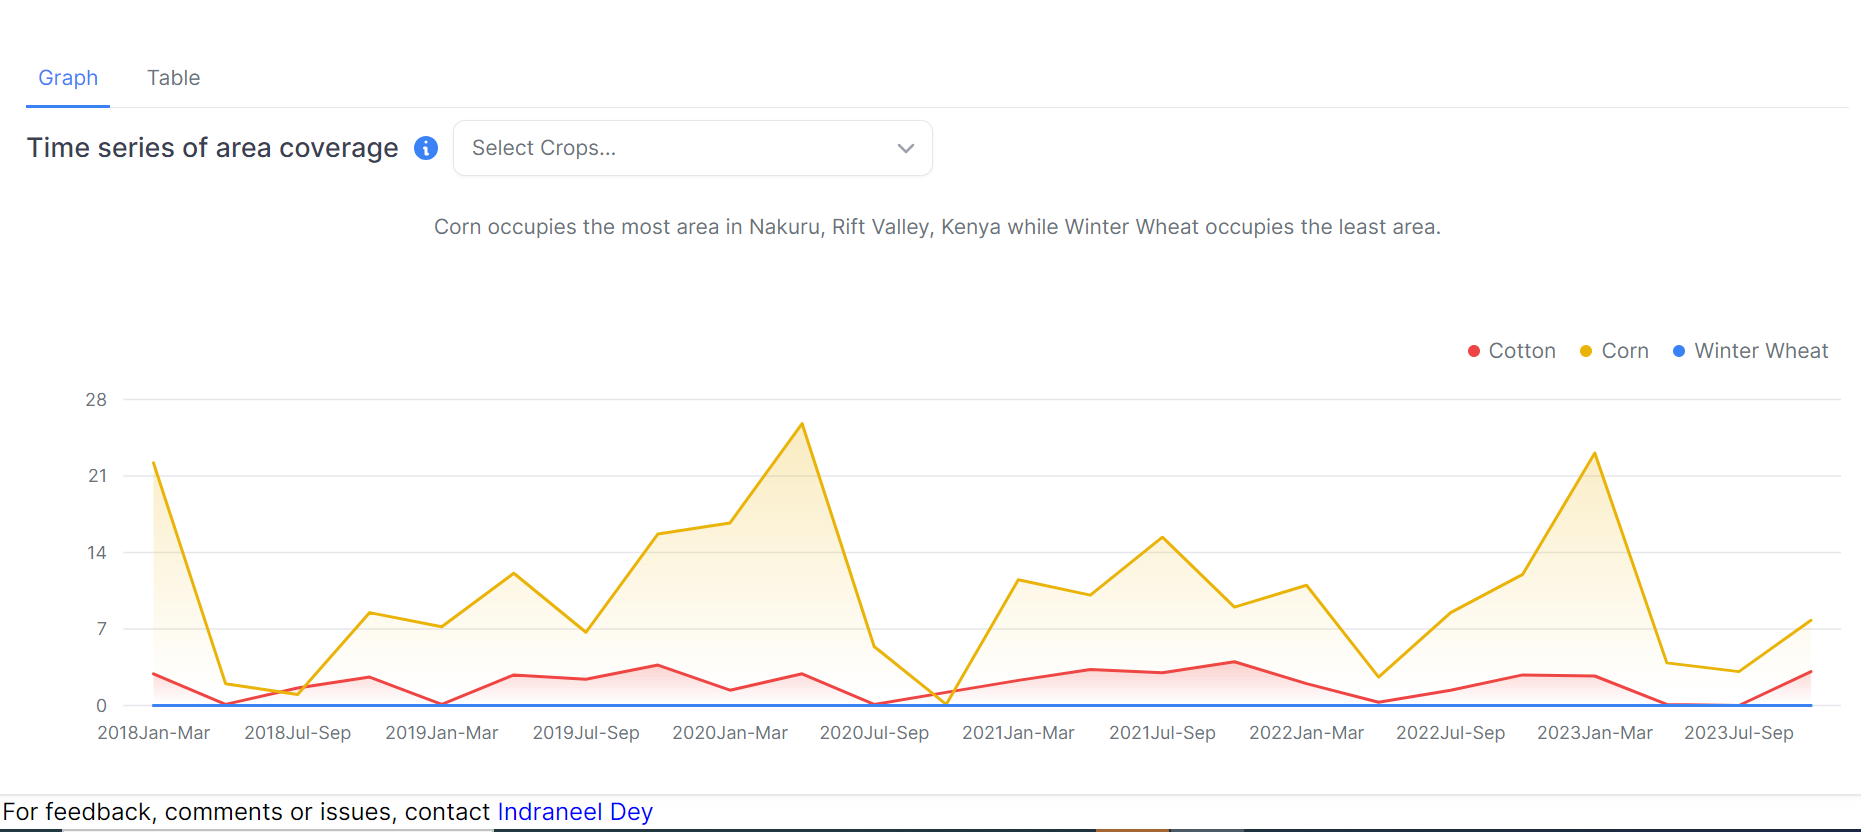
Chart can be filtered to see graph of only specific crops.
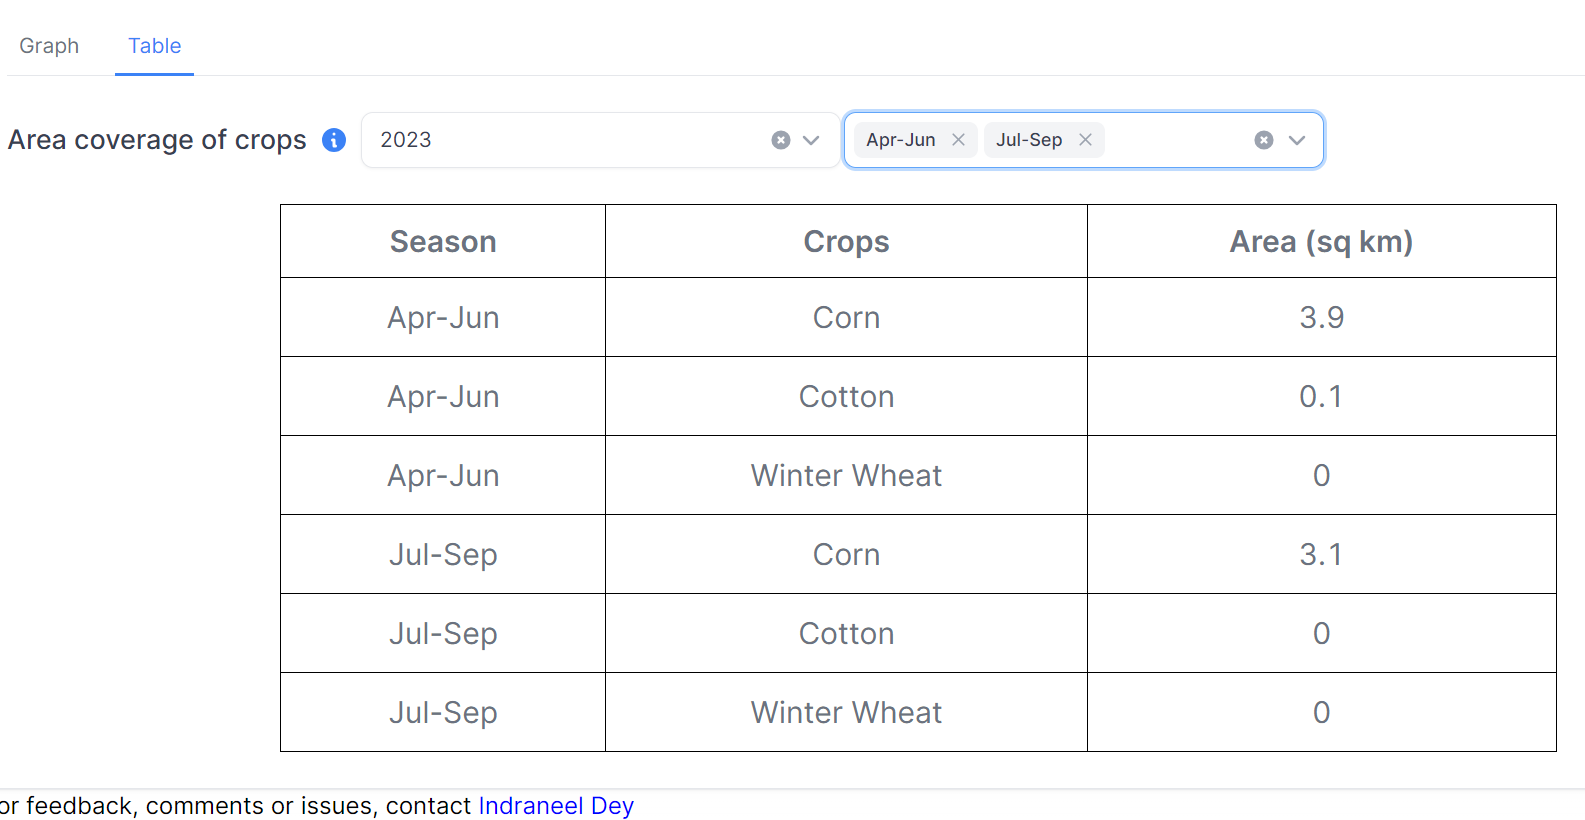
Data can also be displayed in tabular format.
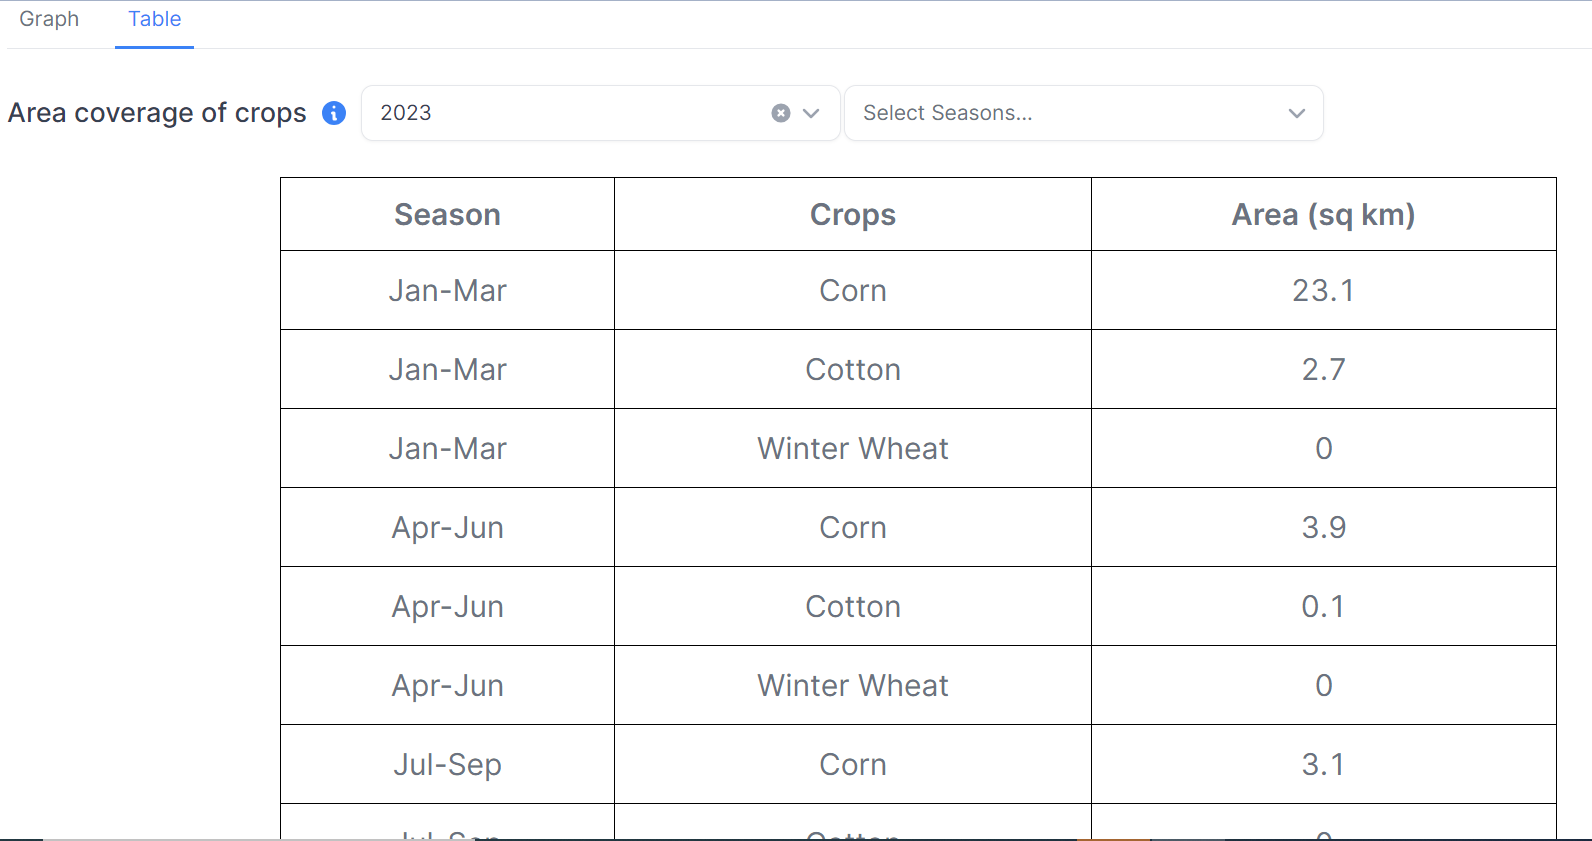
Table can also be filtered to see data of specific seasons.